CabMasterPro User Guide
The Automation Server provides a practical way of generating complex pricelists which you may want to use internally or distribute to your retail outlets.
The concept is very simple. Each cabinet in your library might have several different prices, depending on how you configure it. For example you might choose different door ranges, or different construction methods or whatever. In practice, most libraries are set up with friendly pages so the user picks a configuration then adds cabinets to a drawing. Formulas in the cabinets then cause the cabinet to be a different price, depending on the configuration chosen.
The idea of presentation pricelist generation is to create pricelists showing your range of cabinets and what their price is for each of a number of chosen configurations. We will work through a little example to show how this happens. This example is small and simplified, but the essential steps required are not simplified - the method used here would apply to the most complex of libraries. While working through this example, some comments will be made to assist you in creating real world examples for your own libraries.
Example
We have a library with only 3 cabinets, called PresTest.qil. Each cabinet is available in three construction styles.
Here is a summary of the pricing for this library:
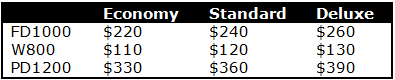
In fact, for this example the prices are simply a fixed price with a 10% 20% or 30% markup depending on the "range" chosen i.e.
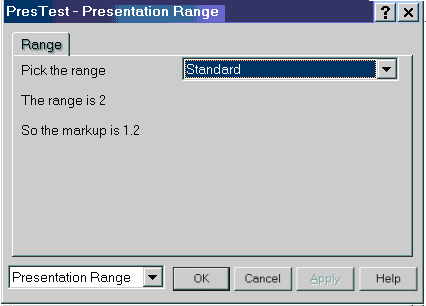
In order to select which range of cabinets we are choosing for a drawing, there is a friendly page, shown here with Standard chosen:
If you look at the workings behind the combo, you will see it is letting you choose Economy, Standard or Deluxe, and setting the drawing properties variable nrange to the value 1, 2 or 3. That causes the markup variable mymarkuppc to be set to 10, 20 or 30, and the actual markup to be set to 1.1 1.2 or 1.3. Cabinet prices change because on their pricing tab there is a fixed cost price, but this markup is applied to get the sell price. This is done by multiplying by the variable mymarkup.
So in a drawing environment, we can change the range selected by picking it from the combo and everything will work fine. But we could also change the range selected by merging an ascii file into our drawing with just the new value of nrange (1, 2 or 3). This is what we will do in the Automation Server environment to pick the ranges one at a time.
We have prepared three ascii merge files. Each has just one line. Here is the first:-
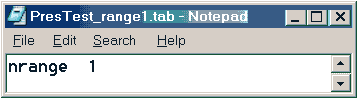
and there are two others called PresTest_range2.tab and PresTest_range3.tab, with values 2 and 3 for nrange. These files are in the correct format for Merge Ascii commands, using the defaults. Full lines from an Export Ascii tab file might look like this:

This is shown above in columns for clarity, but is just a tab separated ascii text file. In it, the third column is the formula, and the fourth column is the context. But since drawing property answers is the default context, we do not need to provide that, and we also do not need a formula for nrange. So the single line shown above (nrange 1) is a perfectly valid ascii merge file.
You can check this as follows:-
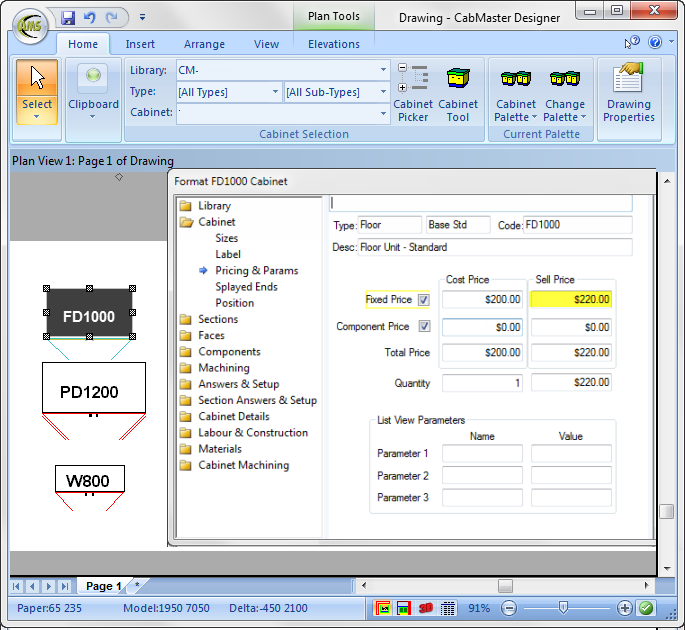
You can also check the pricing for the first cabinet which has now changed to $220, reflecting the new 10% markup:
We are going to use the sample drawing PresTest.qid to provide the collection of cabinets we want to price, and we will use the three tab files PresTest_range1.tab etc.
If you want to create ascii text merge files, you need to identify which variables to set and do it from a tab file instead of from the friendly pages. But you don't need to generate these tab files by hand. You can create an empty drawing based on your library, then select a configuration from your friendly pages. Then do an Ascii Export (Minimal). Do this for each configuration of interest, and you have your tab files which can be merged in later to change configurations. It is usually a good idea to use a text editor (such as Notepad) and delete all the unnecessary lines in these tab files - just keep the ones that really matter - these are the lines that set the values of variables in your library that will be different from one configuration to the next.
Even in a complex library there may only be 5 or 10 lines needed in this file. A quick way of identifying the lines that matter is to take two tab files for different configurations and compare them with a file differencing utility (e.g. WinDiff). This will highlight just the differing lines, and aside from silly ones like the date/time, these are exactly the lines you want.
There's another approach that can be simpler depending on how complex your library configuration changes are. Do not even try to create ascii text merge files - just create empty drawing files (qid files) based on your library, and go into the drawing properties friendly pages, select the configuration, then save a qid file for each configuration.
In our little sample, either approach is easy. To illustrate this second approach, three files have been included called...
- PresTest_range_eco.qid
- PresTest_range_std.qid
- PresTest_range_dlx.qid
If you open these files and look at Drawing Properties, you will see all three are empty, but the combo in the Drawing Properties friendly page is set to select Economy, Standard and Deluxe ranges.
You can try using Merge with these three files instead of MergeAscii with the three tab files in the Automation Server script below, and you should get exactly the same results.
In our sample, the three prefixes eco std and dlx will be used. This can be achieved by simply including a line like this in the merge file -
presentation prefix "eco". In our example, this will not be necessary because we have generated the prefix with a formula. This does the same thing.
The resulting data file with all our pricing will look like this:

Again, this is a simple text file with tabs on each line to separate the name and the price. Compare this to the first table in this article and you will see it contains all the same information. We are now going to show how to use the Automation Server to generate this data file, and how to then use it to generate presentation pricelist reports in a flexible and easy manner.
However, in this sample we are going to illustrate a quite different approach. We will assume you want a more free format layout. Naturally there will be rows and columns of numbers on some pages of your pricelist. But not all cabinets are available in all styles, and we are assuming there are so many exceptions to the rules that in the end it is simpler to just do a layout however and wherever you want those prices and let them be substituted into place.
This is why we have gone for fully descriptive names like Dlx_W800. That is, we know that this refers to style Dlx (Delux) and cabinet W800. Using the tab file generated earlier, and CabMaster's formula creation for the Crystal Reports interface, we now simply set up an empty drawing, merge the table of names and prices into it, then run a Crystal Report from CabMaster.
Merging the tab file causes each line to become a CabMaster drawing property variable (like Dlx_W800). So when we run a Crystal Report, CabMaster will create a single formula for each and every variable. The variables can then be placed anywhere on a Crystal Report as they are formulas, not data values.
Thus the Crystal Report will be all substitution and no report body. Lets assume that the PD1200 is not available in Delux style. Then we would set up a report with these substitutions: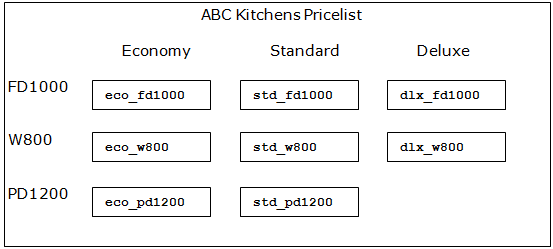
Each formula substitution is added by selecting Insert|Formula Field from the menu. This gives the Field Explorer dialog, and you click on the "New" tool button, which is circled here: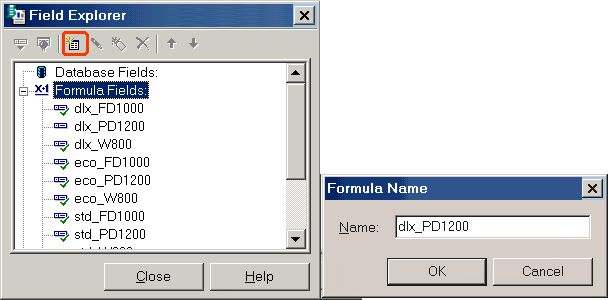
After typing in the formula name (e.g. dlx_PD1200), the Formula Editor Dialog appears: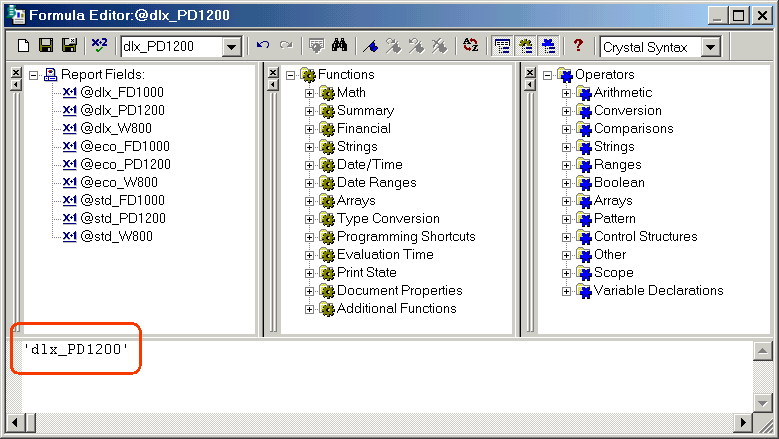
Here we have supplied a constant text string "dlx_PD1200" as the formula for the dlx_PD1200 variable. This is just a place keeper so that when we add the variable dlx_PD1200 to a report during design, it displays this text. At runtime, this text will get replaced by the true value of dlx_PD1200, as obtained from the Drawing Properties by CabMaster. As you can see for our sample data table above, this will become $390.
Whilst it is very repetitive doing the setup for a report like this, it is a one-time job and you have total freedom to place the individual prices wherever you want in the layout - with text, logos, missing values, repeated values, line art and group boxes and so on. Conventional approaches just don't give you that amount of flexibility.
Let's pull it all together now and show the actual steps required to do this report.
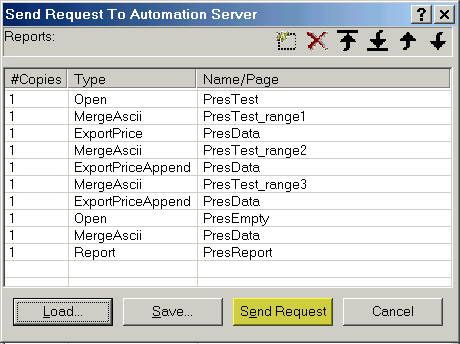
Here is PresData.tab as produced by this sequence, and to the right we show what the PresEmpty.qid drawing properties look like after merging PresData.tab: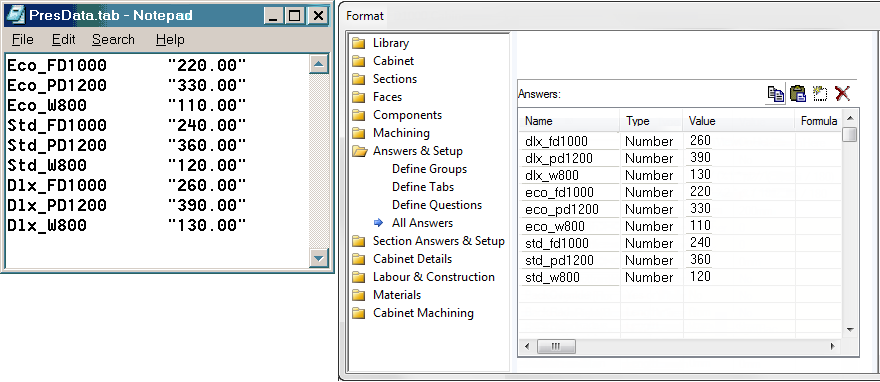
Now when we generate a report, all the drawing properties (dlx_fd1000 etc) will generate individual formulas and these can be used in the Crystal Report by placing them wherever you like.
For the PresTest.rpt report included with this sample, the resulting report was captured and converted to PDF. You can do the same if you want to make PDF format pricelists available to your customers also. In this case, I installed the "Acrobat Distiller" printer (available from www.adobe.com) and set it to print to file. As it tried to print, I saved the PostScript file (included as PresTest.ps). Then I used the Ghostscript postscript viewer (GSView32.exe, available free from www.ghostgum.com.au) to open it and convert it to PresTest.pdf (in Adobe Acrobat format). Here's what this PDF file looks like when viewed in Adobe Acrobat Viewer:
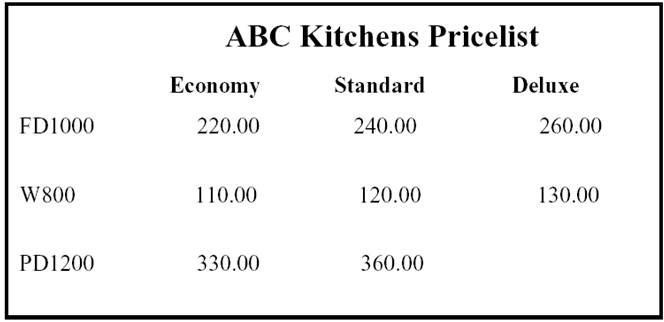
You can open up the rpt file in Crystal Reports to inspect it. There is no data source at all, and the whole report specification is in the report header area. It consists of substitutions only, and although it is laid out in a regular looking table, it could be anywhere, with logos, borders and other line art and so forth, to group pricing information as required.
Notice also that the PD1200 Deluxe price is deliberately missing - as we said earlier, this was our "exception". PD1200 was unavailable in Deluxe for this pricelist.
Using these methods, you can now work on your own libraries and automate the whole process of creating Presentation Pricelists. Once you have set things up, creating a pricelist is as easy as loading a saved script (QAS file) and submitting it to the Automation Server.